the Sim Settlements forums!

Register a free account today to become a member! Once signed in, you'll be able to participate on this site by adding your own topics and posts, as well as connect with other members through your own private inbox!

Long Save Research Tool

@Mystical Panda, @kinggath could you clarify something for me, please?

What does a stack dump mean for the engine? It means it is dropping the calls, i.e., interrupting the tracing and skipping the functions identified on the dump, or does it mean it is freezing the VM so the engine can catch up with the scripts, so the dump is actually the engine running those scripts?

Both are bad, but the implications are different in each scenario.
From what I've gathered a 'stack dump' is just a warning showing the user which scripts have 'piled' up faster than they can either be serviced, or are waiting for another script that has taken more time than expected to complete. I've seen dumps in both 'active' and 'suspended'. In the case of 'active', too many script calls hit the vm too quickly (like a vm bottleneck showing the over the limit scripts which would more than like result in severe script lag for those in excess), and in the case of 'suspended' they're waiting for another stack frame to complete so they can continue. Too many of these 'stack' up and the vm will just 'dump' them in the log visually, but doesn't remove them from vm or 'stack'. Unless there is a deadlock somehow, they will eventually clear up. And that will result in slower than expected response and script times.
 
From what I've gathered a 'stack dump' is just a warning showing the user which scripts have 'piled' up faster than they can either be serviced, or are waiting for another script that has taken more time than expected to complete. I've seen dumps in both 'active' and 'suspended'. In the case of 'active', too many script calls hit the vm too quickly (like a vm bottleneck showing the over the limit scripts which would more than like result in severe script lag for those in excess), and in the case of 'suspended' they're waiting for another stack frame to complete so they can continue. Too many of these 'stack' up and the vm will just 'dump' them in the log visually, but doesn't remove them from vm or 'stack'. Unless there is a deadlock somehow, they will eventually clear up. And that will result in slower than expected response and script times.
Ok, so they could hint to script lag, but will never be out of sync cause they will run anyway. That's it? :)
 
I've been looking at the papyrus log from yesterday night play session and I'm looking for the root of each trace in the dump. Like, if the dump has 2 frames, then I want to see the 2nd (always last, from top to bottom) function call on that dump. Does your tool count these up?
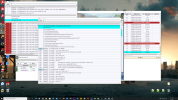
1643875522914.png
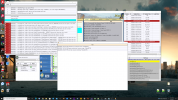
1643875542375.png

At this point, I'm pretty sure that the GC thingy was just a symptom and that the underlining problem is, as you mentioned in your last post, some kind of loop calls that are happening too fast. From last night session, I got 178 individual dumps, cluttered in 2 big stack dumps. From eye observation, they are mostly from the threads in the workshop framework (threadrunner), calls related to the floating icons above the plots and calls in the chain that fires when you enter a settlement.

Are your results similar, @Mystical Panda ?
 
Last edited:
@nosfsos after trying to follow along through all the OT spam...it seems you have some struct questions. Also, was the high amounts of struct creation / deletion mentioned due to not having version m correctly installed?

You were asking about the WorldObject struct. What I can tell you is every object spawned by a building plan, city plan, WSFW layout and plot icons (there may be more I'm forgetting) have the spawn data packaged into a WorldObject struct and passed to WSFW via a place object thread to actually be spawned.

In regards to the HUD, every time a plot requests and gets an update, the old icons are deleted. The new icons are spawned using the same WSFW create object thread described previously. You can tell when this happens by standing in a settlement looking at them. Every time they flicker or change, HUDManager is being called to update that plot's icons. Which IIRC, is a lot.
 
Hey there @msalaba ! Yeah, we spammed a little the past few days, sorry about that :blush

Also, was the high amounts of struct creation / deletion mentioned due to not having version m correctly installed?
Yes, for some reason, MO2 was being dumb. After I manually deleted the previous install and added the m version everything was fine, as it should. I was just testing the M version with Nukem's logging to see if there were any other massive structs creation, but I couldn't find any.

You were asking about the WorldObject struct. What I can tell you is every object spawned by a building plan, city plan, WSFW layout and plot icons (there may be more I'm forgetting) have the spawn data packaged into a WorldObject struct and passed to WSFW via a place object thread to actually be spawned.
It took me around 3 hours to write that post, and in the end (it doesn't even matter!... sorry, it is stronger than me... ignore this parenthesis) I had lost my train of thought and forgot to summarize things xD Nukem's logging only detects structs creation, release and destruction. It was not written to debug massive function calls that might cause script lag. So I intentionally did that test with the version BEFORE the fix, so I could use Nukem's log to see where the calls were coming from. One thing I forgot to mention in that post is that the 6438 structs created as soon as I built a storage correspond to 222 calls for each of my 29 plots at the time, which honestly seems excessive to me. I still didn't find which code is called when you place down an object so I can follow it to see what's happening, but 200+ calls for each plot every time something is built can get out of hand pretty quickly xD

In regards to the HUD, every time a plot requests and gets an update, the old icons are deleted. The new icons are spawned using the same WSFW create object thread described previously.

As for the HUD updates, what concerns me a little is the fact that, unlike in other places, I can't find any control variable to slow down chain calls. Kinggath has them in several places in the code and I'm not saying that they aren't somewhere in the path between the first call update itself. The good thing is that the update function only has one reference in the code, so there is only one place where is being called. The bad thing is that it is inside an event and, from what I understood from kinggath explanation, it is possible for several "instances" of the same event to run in parallel, as long as they come from different places. So an event calling StartTimer on itself will just reset the timer, but a call for StartTimer outside the event might create parallel runnings of the OnTime event(?). Without more knowledge, it is complicated for me to fully understand (and debug) what's going on.

Every time they flicker or change, HUDManager is being called to update that plot's icons. Which IIRC, is a lot.
Yeah, I remember from one of the update videos in SS2 v1.x kinggath mentioned that having the icons always visible was a huge hit on performance, but that's what I want. I want to push the engine to its limit until it screams in pain and then 2 things can happen. Either it's just the way things are and there is nothing to do about it, or there is room for optimization of the code. This is what I mean when I say the GC problem was just a symptom (and thank god it was a symptom that screamed very loudly!). The instances were being created because of a small bug in the code and it was filling the GC. But why were there so many calls in the first place? Was it because it is necessary, or was some unexpected function call loop that passed noticed in the review process? That's what I'm trying to figure out.

I think the tool @Mystical Panda is developing goes in that direction too. He's focused on the stacks dumps since the beginning and I think that his tool will be a huge boost to performance for all the modding community.

Here's a final example to clarify my thought process:
A called and B called C. C is where the instances were being created. But, on other occasions, D called B and B called C. Hotfix M fixes C, but the functions calls behind that are still there. As I said, this might not be a problem, but I like to dissect code xD

Tkx for the input @msalaba. That explains all the ThreadRunner_OnThreadCompleted I'm seeing in my stack dumps (and just so there is no doubt about it, I'm talking about hotfix M).

Just a final note, from the 174 dumps I had the last time, 100 were OnTime() events, from several scripts, but mainly SimPlot and HudManager.
 
@jims1973
Was getting up this morning, for the past weeks on thursday that involves starting up the Chapter 2 Let's Play. Normally I'm at sleep when that event happens :)
Anyways, I was getting myself a cup of coffee and suddenly heard kinggath reading out loud a superchat, I needed to get a new cup of coffee :grin
What a lovely gesture you did, thank you!
 
Ok, so they could hint to script lag, but will never be out of sync cause they will run anyway. That's it? :)
Back online! Yeah, the VM to me, doesn't really give me anything to really help 'balance' what it's doing- it seems 'bare bones' in a way. So it's kind of their way to say "we have limitations and no way to notify you of script overhead or load... so, if things get too crazy or there's in inherit problem we'll just let you know by showing the excess in a text file". With 'stack dumping' you'll start to notice little lags while playing. If there's a recursion on a 'cascade effect' you'll get really noticeable lag spikes. Since the VM doesn't dump the 'over the limit' stacks, just shows you what they are, it'll take the engine time to get caught up. A big problem for users when 'stack dumps' happen, is most don't enable papyrus logging let alone use it. They're probably getting them, they just don't know it.
 
Back online! Yeah, the VM to me, doesn't really give me anything to really help 'balance' what it's doing- it seems 'bare bones' in a way. So it's kind of their way to say "we have limitations and no way to notify you of script overhead or load... so, if things get too crazy or there's in inherit problem we'll just let you know by showing the excess in a text file". With 'stack dumping' you'll start to notice little lags while playing. If there's a recursion on a 'cascade effect' you'll get really noticeable lag spikes. Since the VM doesn't dump the 'over the limit' stacks, just shows you what they are, it'll take the engine time to get caught up. A big problem for users when 'stack dumps' happen, is most don't enable papyrus logging let alone use it. They're probably getting them, they just don't know it.
I gotta be honest with you, in my machine I never felt the engine hanging, but the dumps are definitely there. I believe there are lots of people in the same situation as I. I also love to push the graphics, which usually drops me below 60 fps, so if it hangs for like half a sec I'll just think my fps tanked for some reason.

I'll wait you reply to the other post :grin
 
I've been looking at the papyrus log from yesterday night play session and I'm looking for the root of each trace in the dump. Like, if the dump has 2 frames, then I want to see the 2nd (always last, from top to bottom) function call on that dump. Does your tool count these up?
View attachment 15507
View attachment 15508

At this point, I'm pretty sure that the GC thingy was just a symptom and that the underlining problem is, as you mentioned in your last post, some kind of loop calls that are happening too fast. From last night session, I got 178 individual dumps, cluttered in 2 big stack dumps. From eye observation, they are mostly from the threads in the workshop framework (threadrunner), calls related to the floating icons above the plots and calls in the chain that fires when you enter a settlement.

Are your results similar, @Mystical Panda ?
Those are definitely the symptoms I had before using the GC fix and updating to the M version (on an existing game), and the premise I was working towards. I would get 'stack dumps' that would be spread mostly around SS2 scripts and quite a few of them- not so much now. It was really bad when updating SS2/ C2 using the same game save. That's one reason for a clean test I started a new game with the same set of mods. Before, when things started to 'wonk' out I would see icons appearing and disappearing as the settlements were being built, even though I wasn't in Workshop mode.

For now, I just grab the first frame, not anything deeper which is why I was asking awhile back about whether it's LIFO as seen from the top or bottom. I was assuming the bottom frame to top was recent to oldest but wasn't sure. This gave us something to quickly work with, but didn't really look at imbedded call frames. I noticed in the embedded frames calls they also had a frame 0 by itself (the call they made?) and was curious as to whether that was the sticking point (the frame that was hanging). One thing I wanted to do was create a bottom frame to top report that linked both together- like a real time trace (so to speak) that would include all the frames we see in the dump.

I know from testing that if I start building with RoTC and have build limits disabled (it doesn't respect build limits), then I'll get that very symptom- icons appearing disappearing and blue people in settlements. If at that point I'm like... whoops I forgot to turn that on, then turn it on. It'll still wonk out intermittently from time to time. If I was to guess, It sounds a lot like a multi-threading issue- something I work with here atm. Where, a condition exists preventing a call that's excepted to not have problem has problems, and that de-syncs the process somehow by throwing off what's expected to return back (or doesn't return back).

Can you post up your log with the dumps?
 
Last edited:
I gotta be honest with you, in my machine I never felt the engine hanging, but the dumps are definitely there. I believe there are lots of people in the same situation as I. I also love to push the graphics, which usually drops me below 60 fps, so if it hangs for like half a sec I'll just think my fps tanked for some reason.

I'll wait you reply to the other post :grin
I have an 8/16 cpu that never gets over %40 overall usage during game, a NVmE for the OS, a regular SSD for gaming and overclocked memory. There's quite a few dll injections in the game mods and Reshade to help with color correction. I can tell when I'm playing when the frame rate starts to stutter a bit- which to me starts equating to script lag.

Me too. I only have a 1650 TI here, and I'm pushing 1440p and 2K (sometimes 4K) graphics and mesh mods. I use grasslands and a bunch of others. So 60 is not really a consistent fps for me, but most of the time is very playable at around 40-50ish. In the bad spots it'll dip into the 20's but there has to be lots of structures and shadow processing. It's a GPU bound situation. I also use everything on ultra, including draw distance, except for shadows and god rays (I still use them, just not at ultra). Another thing I changed was the minimum distance at which higher res textures would load and unload. This looks way better visually to me, but I had to step it down a bit... and use tamer settings,

Hopefully, if all goes well I'll be removing that bottleneck very shortly.
 
Here's the settings that I used to improve the fidelity of the draw distance. I cut it down from what I read others were using, but will up it again during the next hardware upgrade cycle. I marked the settings, though the first one, I think, should be set to a 1. For now I have it at 0. The larger those numbers the more detailed it looks further out, but it'll eat up VRAM and you'll get small lags while looking around (at least for me and the card I presently use) while the gpu has to load and manage larger texture sets.
 

Attachments

  • screenshot-04.png
    screenshot-04.png
    2.2 MB · Views: 8
Here's from the test I did last night. As you can see, there's still 'stack dumps' (just looking at each initial dump frame, but not going deeper into the stack as this would require more parsing to link the frames to each other and determine which values would be the most important to report and the process to translate to code).

This is from starting a new game with M and the GC fix. Interestingly enough I haven't seen a single crash yet, though I'm wanting to budget time in to see if I can consistently get beyond the 3-4 hour mark without incident. In my opinion, the GC fix will help the game engine 'overall' and not so much a SS2 did this and now requires this... kind of thing. That's what I'm noticing. The engine seems less clunky as it now can free custom (or more complex) structures in the time allotted, where as before it couldn't and had an inefficient way of doing things. I'm guessing that Beth, did a top down array walk, which would cause a problem if an element was deleted mid walk- indexing would be different, instead of using another style or a last to first walk instead.

Just guessing though.
 

Attachments

  • screenshot-05.png
    screenshot-05.png
    1.7 MB · Views: 3
Can you post up your log with the dumps?
Unfortunately, I already overwrote the ones from yesterday. But here's 4 from today, all with dumps.
For now, I just grab the first frame, not anything deeper which is why I was asking awhile back about whether it's LIFO as seen from the top or bottom.
Yeah, I saw your questions but I wasn't understanding what you were talking about, so I didn't answer. Usually, stack traces are always in a stack format, meaning FILO. You build the function calls like a stack of books and then you print the whole stack (you don't take from the top and print one each time, otherwise it would be reversed). So if A calls B and B calls C, your stack will be:
C
B
A
Where A is where the chain started and C is where it ended.
[02/03/2022 - 01:26:28PM] Dumping stack 1618813:
[02/03/2022 - 01:26:28PM] Frame count: 5 (Page count: 5)
From what I understood from the papyrus logs, this means this stack has 5 function calls
utility.Wait()
simplot.SpawnStageModel()
simplot.UpdateIndicators()
simplot.PostInitialization()
simplot.OnTimer()

Meaning this function call that was in the stack originated from an OnTimer() event in the SimPlot script (in other words, has its root on simplot.OnTimer()). This is the first dump in Papyrus.0.log at line 1424 if you want to take a closer look.

By counting the root of all stacks we might start finding some patterns that might point where the code can be improved.
I'm guessing that Beth, did a top down array walk, which would cause a problem if an element was deleted mid walk- indexing would be different, instead of using another style or a last to first walk instead.
I hope not... that's a real beginners mistake. Anyway, CE is coded in C++, so I'm guessing they had to build their own GC.
 

Attachments

  • papyrus logs.zip
    576.4 KB · Views: 1
Unfortunately, I already overwrote the ones from yesterday. But here's 4 from today, all with dumps.

Yeah, I saw your questions but I wasn't understanding what you were talking about, so I didn't answer. Usually, stack traces are always in a stack format, meaning FILO. You build the function calls like a stack of books and then you print the whole stack (you don't take from the top and print one each time, otherwise it would be reversed). So if A calls B and B calls C, your stack will be:
C
B
A
Where A is where the chain started and C is where it ended.

From what I understood from the papyrus logs, this means this stack has 5 function calls
utility.Wait()
simplot.SpawnStageModel()
simplot.UpdateIndicators()
simplot.PostInitialization()
simplot.OnTimer()

Meaning this function call that was in the stack originated from an OnTimer() event in the SimPlot script (in other words, has its root on simplot.OnTimer()). This is the first dump in Papyrus.0.log at line 1424 if you want to take a closer look.

By counting the root of all stacks we might start finding some patterns that might point where the code can be improved.

I hope not... that's a real beginners mistake. Anyway, CE is coded in C++, so I'm guessing they had to build their own GC.
That's how I was thinking they were reporting it, but wasn't sure. In that case, everything is waiting on the utility.wait to complete which should put them in the suspended stack pile (as they are suspended until they get their return). If you notice in the previous posts I'd made with dumps there was a huge spread on SS2/C2 script references in the dumps... not really so much now. Now it could possibly be down to script design, shared resource mitigation... not sure as to what the wait is for.
 
That's how I was thinking they were reporting it, but wasn't sure. In that case, everything is waiting on the utility.wait to complete which should put them in the suspended stack pile (as they are suspended until they get their return). If you notice in the previous posts I'd made with dumps there was a huge spread on SS2/C2 script references in the dumps... not really so much now. Now it could possibly be down to script design, shared resource mitigation... not sure as to what the wait is for.
I posted a QaD tool a bit back that just parses the papyrus log pulling out the top frame from each dump. That's what I used on the logs you posted. The spread is sorted from most to least and doesn't contain anything deeper than the topmost frame. A few of these looked very similar to what I was getting before starting a new game with M and the GC improvement- a higher spread on SS2/C2 script calls.

It's still a new game with very basic RoTC auto-cities atm- not more than 4-5 now, so settlers are few. Sometimes very few. I won't know the progression until I get more going on and the city levels start hitting 3 or better.
 

Attachments

  • stackdumpinfo-0.txt
    5.4 KB · Views: 0
  • stackdumpinfo-1.txt
    3.7 KB · Views: 0
  • stackdumpinfo-2.txt
    1.1 KB · Views: 0
  • stackdumpinfo-3.txt
    3.9 KB · Views: 1
I posted a QaD tool a bit back that just parses the papyrus log pulling out the top frame from each dump. That's what I used on the logs you posted. The spread is sorted from most to least and doesn't contain anything deeper than the topmost frame. A few of these looked very similar to what I was getting before starting a new game with M and the GC improvement- a higher spread on SS2/C2 script calls.

It's still a new game with very basic RoTC auto-cities atm- not more than 4-5 now, so settlers are few. Sometimes very few. I won't know the progression until I get more going on and the city levels start hitting 3 or better.
Trying not to sound ungrateful, it would be too much of a hassle to go down the frames? Even if getting only the bottom is too much work, getting the full stack (all frames) and counting how many of them are equal would help a lot :grin

Great work btw!
 
Trying not to sound ungrateful, it would be too much of a hassle to go down the frames? Even if getting only the bottom is too much work, getting the full stack (all frames) and counting how many of them are equal would help a lot :grin

Great work btw!
It doesn't sound ungrateful at all. Not really, it's no more than parsing the text out, looking for key fields or identifiers and going from there. That's one thing I have on the 'to do' list. With that addition I'm wanting to generate more a script 'map' showing how the scripting flows. This will require merging both the papyrus and profiler logs into one, or starting with the profiler then linking back to papyrus and gaining a better understanding of just what Beth is actually logging. Once I have a mental roadmap of what I'm trying to accomplish it shouldn't be too difficult.. It'll be in a bit though.
 
It doesn't sound ungrateful at all. Not really, it's no more than parsing the text out, looking for key fields or identifiers and going from there. That's one thing I have on the 'to do' list. With that addition I'm wanting to generate more a script 'map' showing how the scripting flows. This will require merging both the papyrus and profiler logs into one, or starting with the profiler then linking back to papyrus and gaining a better understanding of just what Beth is actually logging. Once I have a mental roadmap of what I'm trying to accomplish it shouldn't be too difficult.. It'll be in a bit though.
that would be awesome! xD
 
@nosfsos ... here's a quick play test during coding breaks. The game session was about 40 minutes, I wasn't around any settlements and there are still about 5 RoTC settlements grinding away in the background somewhere. I saved quite frequently and you can see there were no 'stack dumps' and no 'long saves'. Granted, this is only for this session and it might 'produce' under other circumstances.

One thing about 'stack dumps' is, when the VM is overloaded, especially with 'active' scripts I don't believe from what I'm seeing is it's not 'pre-emptive' at all- it's 'first come, first serve'. This means that when it's raining and there are a lot of npcs about while using something like WetEffects (which adds water drop effects to npcs like dripping), there will be 'active' stack dumps as I believe the mod author does an 'on attach' to add his 'dripping' script to each npc (you can turn this off and just have it on the player). This happens since the VM will get slammed with function calls from all those 'attached' scripts. This mean that if something like SS2 comes in behind that, it'll get dumped also since the limit was already breached, and it's scripts are running too and coming in after the fact.

Suspended stacks should be a different animal, and to me, would imply that too many script instances or functions are fighting (arbitrating access) each other, which due to the 'hold up' or 'slowing down' causes them to build up quickly. Especially if quite a few objects have scripts attached and they're starting to fire off as the engine sends events those scripts registered as they happen such as 'on loaded' for 3d objects.
 

Attachments

  • screenshot-06.png
    screenshot-06.png
    1.8 MB · Views: 3
Top